What Is Pythagorean Winning Percentage?
- bmayer54
- Jun 14, 2024
- 4 min read
Updated: Jan 10, 2025
Baseball's Pythagorean winning percentage has little relationship to the Pythagorean Theorem. The Pythagorean Winning Percentage doesn't calculate the sides of a right triangle but instead, it helps determine a team's expected winning percentage based on its runs allowed and runs scored where winning percentage is the number of wins divided by games played. To calculate this you do (Runs Scored)^2 divided by (Runs Scored)^2 + (Run Allowed)^2. Although raising Runs Scored and Allowed to the 1.83th power is considered more accurate the data here reflects raising them to the 2nd power. From this Pythagorean Winning Percentage, we can find a team's expected wins by taking the team's Pythagorean and multiplying it by the team's number of games. Team's number of games minus expected wins gives you expected losses. We can tell which teams were better or worse than expected with Pythagorean Winning Percentage. So let's see if we can determine what causes this disparity and what it tells about those teams.

This graph shows each teams' difference between expected winning percentage and actual in 2023. The positive percentage means they were better than expected while the negative means they were worse than expected. The teams are in order of their winning percentage in one run games so CIN has the worst while MIA has the best. Since one run has little effect on the difference between Runs Allowed and Scored one would think that teams with a high winning percentage in one-run games would be better than expected and the opposite effect for low winning percentages in one-run games. The top 6 teams in one-run game winning percentage follow this trend though this relationship is not held consistently across the rest of the graph. Both teams not playing an equal number of one-run games and most teams playing around .500 in these games weaken the effectiveness of this relationship. Additionally, looking at 2 or fewer run games would better encompass this relationship, and looking at big differential games would help show if there is an opposite effect.

This graph shows the relationship between a team's difference in wins and expected wins with different levels of success each year in the 21st century. The positive numbers represent the number of wins above what's expected and the negative numbers represent the number of wins below what's expected. As the levels of success increases the range of the differences in wins decreases due to the number of teams decreasing. Additionally, as the levels of success increases more teams have negative differences than positive differences. This means that a majority of the successful teams in baseball are expected to be better than they actually did in the regular season. Now teams playing above their merits can have success but the odds are not in their favor. For the unsuccessful teams, it's harder to pinpoint a relationship as both sides of the expected can lead to unsavory results. Being worse than expected can sink your season and being better than expected can still land you with not enough wins to make the postseason.
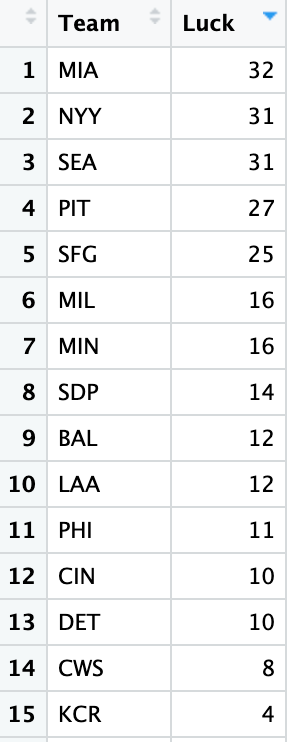

This chart displays the team's overall difference in wins and expected wins (Luck) in the 21st century. The luckiest team has been the Miami Marlins while the unluckiest has been the Toronto Blue Jays. Let's see if there are any trends these two teams followed with their wins and expected wins in the 21st century.


For the Marlins graph each time the red line (Wins) increases and exceeds the turquoise line (Expected Wins) in the next few years the red line decreases back to the turquoise line. This means teams that overperform tend to reduce back to their mean. This is none more apparent than the overperforming 2023 Marlins facing a steep drop-off in 2024. Similarly, for the Blue Jays graph each time the turquoise line increases and exceeds the red line in the next few years the turquoise line decreases back to the red line though this version is a lot less concrete. This means teams that underperform tend to increase back to their mean. This analysis of underperforming and overperforming teams is important in looking at trends year to year though one must also consider that the makeup of a team, its goals, and its opponents changes from year to year as a factor.
The Pythagorean Winning Percentage can lead to some interesting insights about teams and their performance. The name of the game is scoring more runs than you allow and Pythagorean is great at capturing this. However, this fails to acknowledge that all wins and losses are not created equally. So I think that a new stat compensating for big and small wins and losses could lead to some more interest and maybe even more accurate insight. This would help us better appreciate the beauty of baseball which is what we are all trying to do.
Make sure to subscribe to the Newsletter with the link below for updates on when new blogs are released


Comments